Real-Time Analytics Overlays Transforming Esports Viewership
Written by Kai Coleman · Jul 28, 2026
Real-Time Analytics Overlays Transforming Esports Viewership
Real-time analytics overlays have become a standard feature in live esports broadcasts, where data visualizations appear alongside gameplay to display player metrics, team compositions, and predictive models. These elements integrate directly with streaming platforms such as Twitch and YouTube, allowing viewers to access layered information without interrupting the main feed. In July 2026, major tournaments incorporated these tools to present heat maps, damage distributions, and win probability charts that update continuously during matches.
Core Components of Analytics Integration
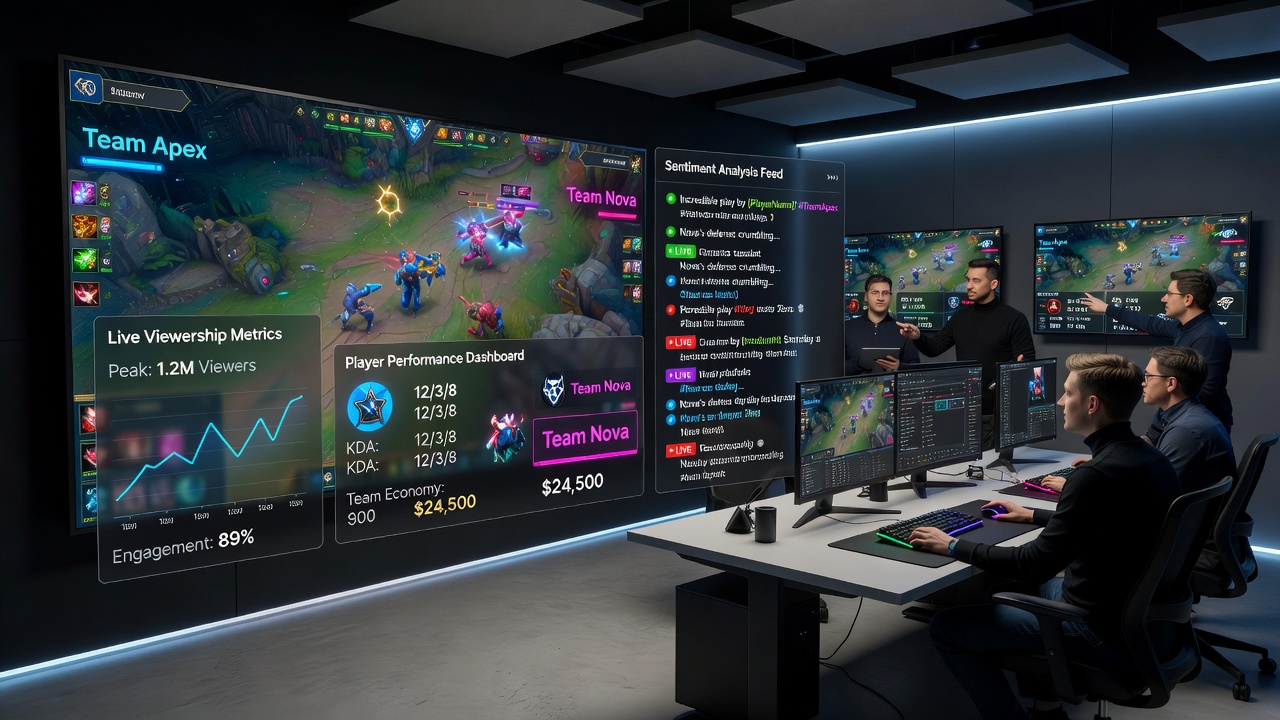
Broadcast production teams combine API feeds from game engines with custom software to generate overlays that show kill-death ratios, economy tracking, and positioning data in real time. Developers at organizations like Riot Games and Valve have released public endpoints that third-party services use to pull this information securely. Viewers on desktop and mobile apps interact with toggle options to customize which statistics appear, while the underlying broadcast maintains a consistent visual layer for all audiences. Studies from the Entertainment Software Association indicate that such features appear in over 65 percent of top-tier competitive events streamed during the first half of 2026.
Expanding Participation Through Interactive Layers
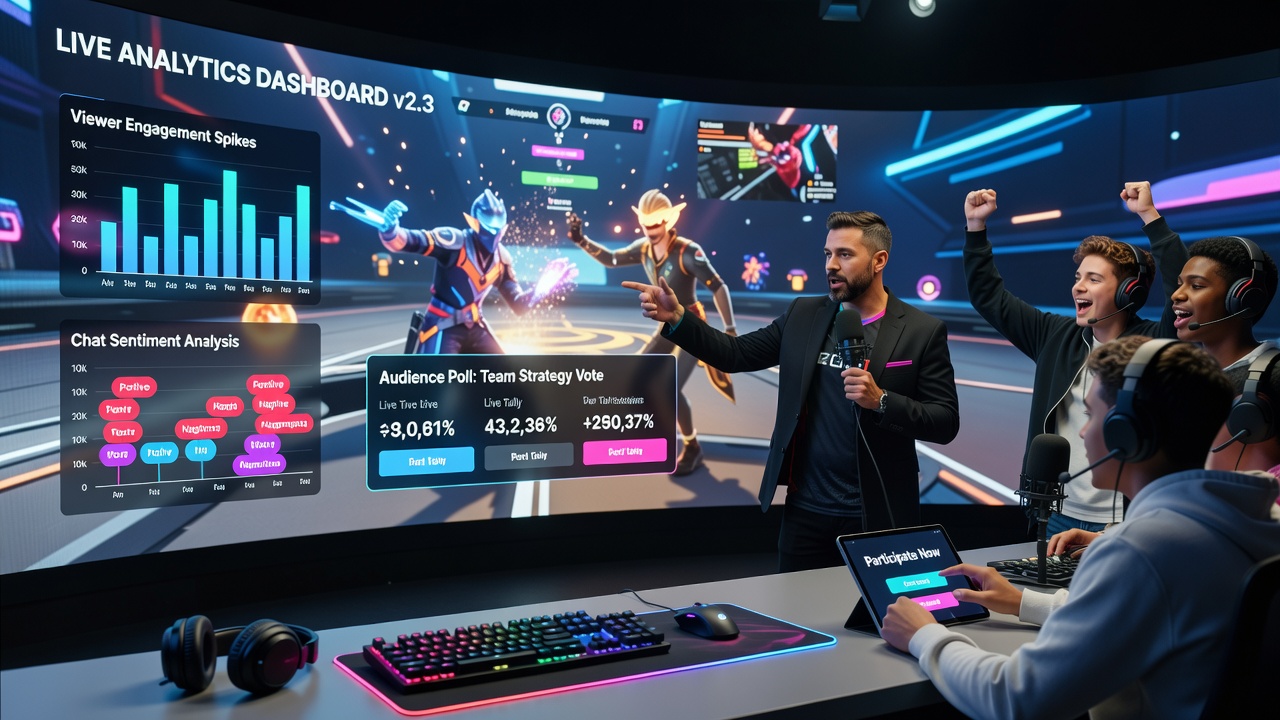
Streaming services now embed polls and prediction mechanics directly into analytics overlays, letting audiences vote on next-round strategies or forecast match outcomes while watching. These tools connect to platform accounts, recording participation rates that rise when viewers see their selections reflected in subsequent data displays. One study from the University of Sydney's Digital Media Research Centre tracked a 28 percent increase in average session duration on platforms using these combined systems during regional qualifiers. Data from integrated chat systems reveal higher message volumes when overlays highlight viewer-predicted events as they unfold.
Platform-Specific Implementation Patterns
Twitch extensions handle overlay rendering through dedicated APIs that sync with game servers at sub-second intervals, whereas YouTube relies on its Super Chat and live polling infrastructure to merge analytics with viewer comments. Mobile viewers experience adapted versions that scale graphics for smaller screens while preserving core data points. European Esports Federation reports document that cross-platform synchronization reduced latency discrepancies to under 150 milliseconds across services in 2026 tournaments. Production crews test these integrations during practice sessions to ensure stability under peak concurrent viewership loads exceeding two million simultaneous connections.
Measured Effects on Audience Retention
Analytics overlays correlate with extended watch times and repeat viewership across multiple regions. Platforms report that users who activate at least one interactive data element remain connected 22 percent longer on average than those who do not. Canadian regulatory filings from the CRTC note rising adoption of these features in domestic esports coverage, with participation metrics climbing steadily through mid-2026. Observers note that overlays also support accessibility by providing text-based summaries of complex game states for viewers unfamiliar with specific titles.
Technical Challenges and Solutions
Integrating live data requires robust error handling to prevent overlay desync during network fluctuations or game updates. Engineers deploy redundant data pipelines that switch automatically when primary feeds experience interruptions. Research published by the IEEE Computer Society highlights successful deployments that maintain overlay accuracy above 99 percent during high-stakes events. These systems also incorporate viewer location data to comply with regional content rules without disrupting global streams.
Future Directions in Overlay Development
Developers continue refining machine learning models that generate contextual insights tailored to individual viewer preferences while preserving broadcast neutrality. Early tests in July 2026 showed promise for personalized overlay subsets delivered via client-side rendering. Industry groups track these advancements through standardized benchmarks that measure both technical performance and audience interaction rates across diverse titles and regions.
Conclusion
Real-time analytics overlays now form an established part of esports broadcasting infrastructure, connecting game data with streaming platform tools to support broader viewer involvement. Metrics gathered through 2026 demonstrate consistent patterns of increased session lengths and participation when these elements appear in live coverage. Continued refinement of integration methods ensures these features scale with growing audience sizes while maintaining synchronization and accessibility across devices and services.