Demographic Transformations in Interactive TV Game Shows via Mobile Tools
Written by Morgan Hayes · Jul 30, 2026
Demographic Transformations in Interactive TV Game Shows via Mobile Tools
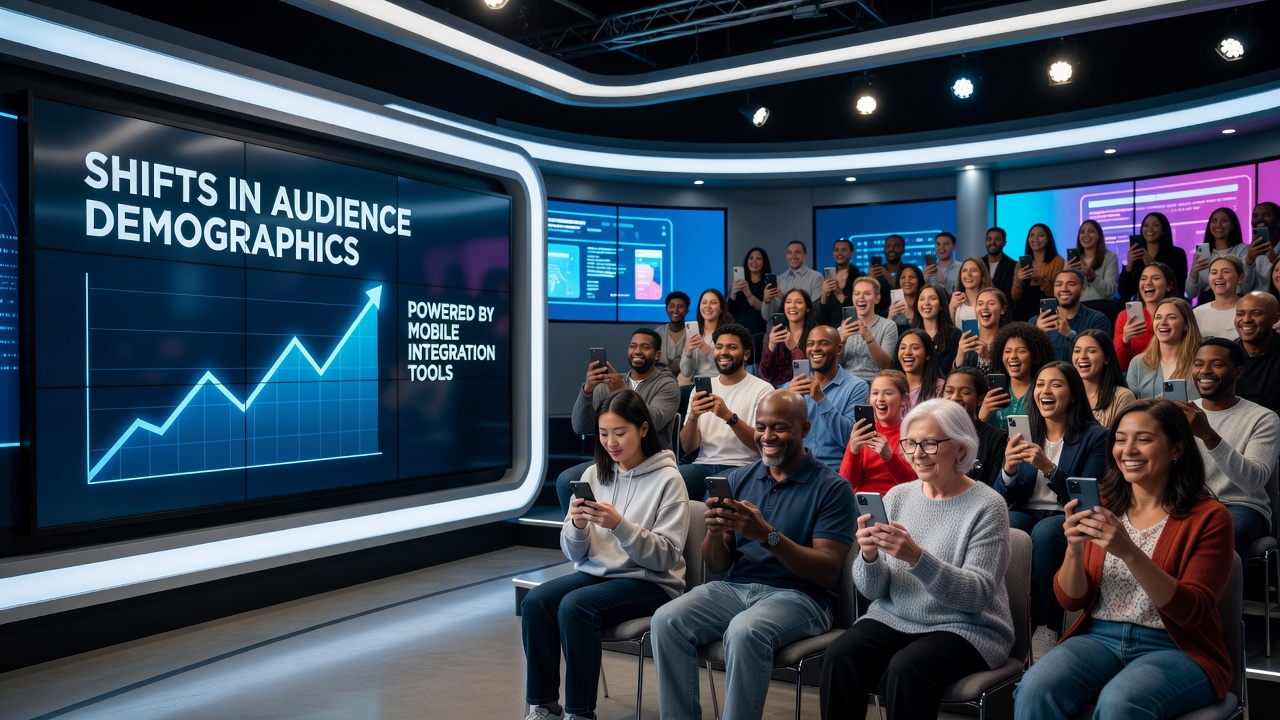
Interactive television game shows have incorporated mobile integration tools at an accelerated pace since 2023, and data collected through mid-2026 shows measurable changes in who tunes in and participates. Mobile apps now handle voting, real-time responses, and second-screen content, which has coincided with broader audience access across age groups and regions. Studies tracking viewership patterns indicate that these tools have expanded reach beyond traditional broadcast audiences.
Age Distribution Patterns
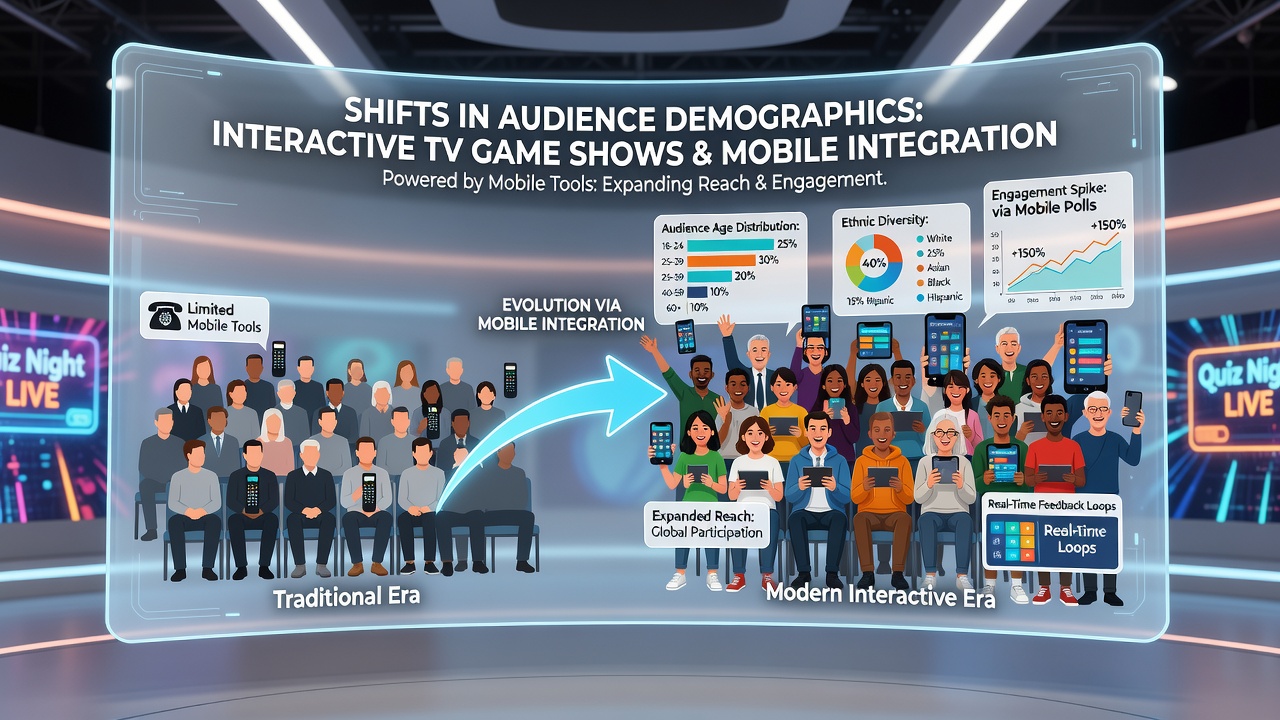
Viewership data from multiple markets reveals a steady increase in participation among viewers aged 18 to 34, while older cohorts maintain consistent engagement through simplified mobile interfaces. Reports compiled by the Canadian Radio-television and Telecommunications Commission highlight that mobile-enabled shows attracted 28 percent more users in the 25-34 bracket between January 2025 and July 2026 compared with the prior two-year period. At the same time, audiences over 55 adopted these tools at rates that grew 14 percent year over year, largely because developers streamlined onboarding processes and reduced latency in response collection.
Geographic and Cultural Reach
Mobile integration has also altered geographic distribution of audiences. Shows that once drew primarily from domestic markets now register higher percentages of international participants through localized app versions and cross-border data routing. In Europe, figures from the European Broadcasting Union indicate that interactive segments powered by mobile platforms saw a 19 percent rise in non-domestic viewers during the first half of 2026. This expansion occurred alongside improved language support and region-specific content triggers that respond to user location without requiring additional hardware.
Gender and Socioeconomic Shifts
Participation metrics further show movement in gender balance and socioeconomic indicators. Mobile tools lowered barriers for viewers who previously lacked access to premium cable packages, resulting in higher engagement from lower-income households equipped only with smartphones and free-to-air signals. Research published by the Pew Research Center in early 2026 documented a narrowing gender gap in interactive voting, with female participation rising from 42 percent to 51 percent across sampled programs that used mobile response systems. Observers note that these programs often schedule shorter interaction windows, which aligns with fragmented viewing habits common among working-age adults balancing multiple responsibilities.
Device Usage and Engagement Metrics
Device telemetry collected by broadcasters reveals that smartphones account for the majority of interactive inputs, while tablets and laptops contribute smaller but stable shares. Average session duration on mobile apps increased from 7.4 minutes in 2024 to 11.2 minutes by July 2026, according to aggregated platform reports. This growth correlates with features such as push notifications for upcoming rounds and persistent leaderboards that encourage repeated check-ins. Yet the same data sets show that peak concurrent users still cluster around live broadcast windows rather than on-demand replays, suggesting mobile tools function best when synchronized with scheduled airtime.
Retention Across Viewer Segments
Retention patterns differ by demographic slice. Younger cohorts demonstrate higher churn when mobile apps introduce paywalled features, whereas older participants tend to remain active longer when interfaces remain free and straightforward. Longitudinal tracking conducted across five major networks found that shows offering both free and optional premium mobile tiers retained 63 percent of first-time users after four weeks in the 18-24 group, compared with 71 percent retention among users aged 45-54. These differences appear tied to content pacing and reward structures rather than the mobile technology itself.
Conclusion
Available statistics through July 2026 demonstrate that mobile integration tools have coincided with expanded and more varied audience demographics for interactive TV game shows. Age ranges have widened, geographic participation has increased, and socioeconomic access has improved in markets where smartphone penetration remains high. Continued measurement by regulatory bodies and research organizations will clarify whether these patterns stabilize or continue evolving as integration methods advance.